

First, a picture’s worth a thousand words:
So, I’m pretty deep in it for this piece, making it kind of difficult to explain to someone who is not, what they are looking at.
Ok, so, the last round of stuff was basically just data layer management. This provided the foundations needed for effective stock forecasting. At this point I’m now working on the price/volume forecast engine.
The actual forecasting engine is a few different pieces this time around. Last time I had just one forecast engine component and it didn’t do very well, because it would get the magnitudes about right, but not the signs as reliably as it needed to. You see, determining “whether a stock will go up or down tomorrow” and determining “how much a stock will go up or down tomorrow” are different forecast types. One is a binary classification that is specialized to that, and one is a magnitude regression. They each require different kinds of specialization to optimize it to do one or the other, so, to really do this right, I need one that is specialized to tell me which ones will go up, and one specialized to tell me how much each of those will go up.
This piece is supposed to tell me “which ones will go up”, or “the signs” of the expected change.
So far pretty simple.
Unfortunately, XGBoost, which is best in class at this type of regression, is only going to get about 60% on well told dataset in this context. To really get any kind of accuracy you need to generate feature columns instead of just giving it price history and volume by day and hoping good numbers come out.
Then the feature columns need adjusted and tailored to your forecast goal. You can’t just give it data like an oracle and expect the future to come out. It’s more complex than I’m describing.
I ended up creating these feature columns:
- ema
- rsi
- macd
- bollinger_bands
- obv_daily
- obv_interval
- mfi
- pbf_morning_momentum
- pbf_overnight_gap
- pbf_return_2d
- pbf_volatility_5d
- pbf_vs_sma_5
- vwap
- order_flow_imbalance
- realized_volatility
- opening_strength
- volume_profile
- tick_distribution
- price_rejection
- volume_price_divergence
- cumulative_delta
- range_position
- momentum_acceleration
- volume_momentum_confirmation
- exhaustion_signals
- daily_returns
- failed_moves
- recent_range_context
- lag_shelf
I won’t even begin to explain what these do. If you know, you know, if you don’t you don’t. But this was alot more math than I like doing. Necessary, though.
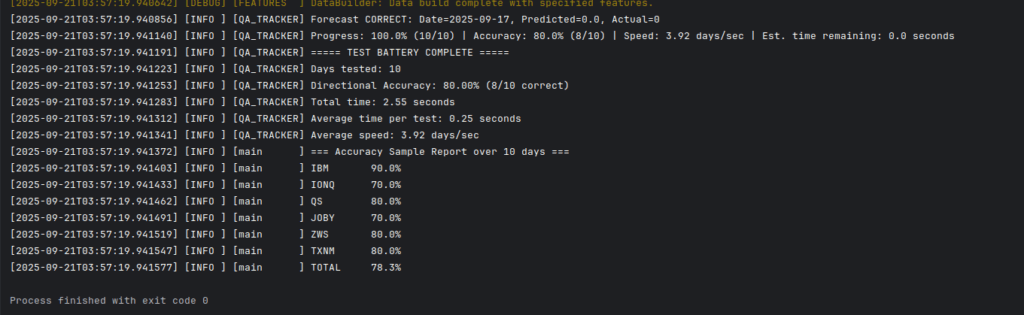
I wish that were the end of the complexity train on this. It’s not. Unfortunately, different securities on the stock exchange have different tells and so different stocks are going to have different features that improve their predictability with a gradient boosting model. That’s going to require per-symbol selection of features to use as you can’t just “turn them all on for every symbol” or the results are just pure noise. Since new symbols pop up in the market every day, selecting those by hand and configuring each one is going to be a full time job. So, you need a “per-symbol configurator”. What this does is it iterates through every symbol in its inventory (which is updated by the market changes automatically), and runs a 10-20 day or so forecast, walking back a day at a time and counting how many hits it got correct out of the total run. It’s an “incremental walkback” I guess. Once it has that, it knows the feature set for the last 10-20 days is X% accurate, or that would be it’s “directional accuracy” score when guessing whether a stock will go up or down.
So, for each symbol it will enable the features one by one, compare scores to the baseline (no features) and those that increase the score get kept for the next test, until you have a full list of which features improve directional accuracy in your forecasting model. It is time consuming, processor consuming, and extremely boring, but it increases accuracy by about 30-40% usually. And it did. So, that’s the image you’re seeing above, showing that of the last 2 trading weeks, it would have been right on those stock symbols that percentage of time. 90% accuracy on IBM over 10 days is well, well outside of random margin and good enough to trade on, but it’s an exception. 70-80% seems like it’s going to be a common thing.
This component will be one that I have to work on for a while even after it’s been deployed and stocks are being bought and sold, but, it’s in a great state compared to previous versions of tetsuo.
But, I’ve been burned by promising results alot on this project, so, I’m choosing not to get excited until money is in my hand. And, it’s only one piece of the distributed tetsuo puzzle and it’s hardly finished. It’s a working prototype currently.
I’ll need to polish it up and clean it up to get it ready for deployment and consumption by the other components that will depend on it. At the end of the day, that process will make it just another data layer.
The configurator is the remaining hard part. It’ll need to run almost constantly in the background to keep the features correct for each symbol because when “regimes” change in the market, you’ll need a fresh test result of which features are best because that’s what changes the DA.
I’m tired on this one. This was so much work work and so much working through disappointment to get to this point with nothing to gain for it still besides old familiar promises.
've been relentlessly banging on this anvil
in the dark
with nothing, but mindless, reasonless hope
until slowly fire and sparks begin to show--
and the blade begins to take form, and red its glow--
my hammer dons its signature blue arc
and doubts unravel
wrought plans of mine are brought to scope
with lightning, madness, fury in yoke